![]() Across the U.S. and in Colorado, health care costs continue to rise. But what kind of costs are economists, policy makers and others referring to when they talk about making health care more affordable? It honestly depends on who is talking, what data they are using, and what parts of health care costs they are referring to.
Across the U.S. and in Colorado, health care costs continue to rise. But what kind of costs are economists, policy makers and others referring to when they talk about making health care more affordable? It honestly depends on who is talking, what data they are using, and what parts of health care costs they are referring to.
I know we say it a lot, but it turns out that like other parts of health care, understanding costs is complicated and exacerbated by the fact that there isn’t a whole lot of transparent information available (enter the need for “Plaintalk” blogs!). Luckily for Colorado, through the Colorado All Payer Claims Database (CO APCD), we have access to information that makes up a large portion of overall costs. These cost data are essential to identify how we might change our current upward trajectory.
To illustrate what the CO APCD contains in relation to other costs involved in health care, let’s break it down into the big pieces that make up your health care costs.
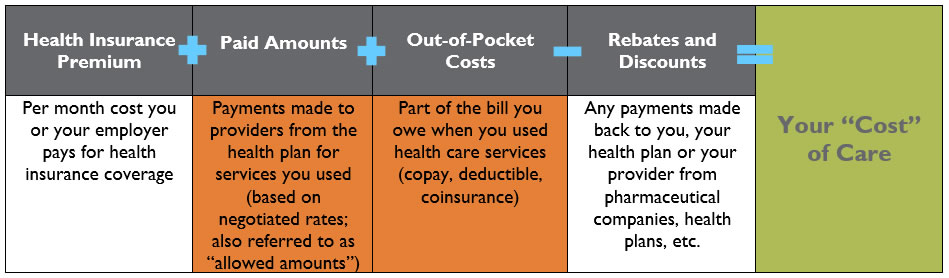
The two columns highlighted in orange above – Paid Amounts and Out-of-Pocket Costs – are the pieces of the puzzle that the CO APCD includes and are available in the Cost of Care report on our website. They represent what actually gets paid on your behalf for services you used and how much of the bill you owed.
Each year, health insurance companies look at all of the payments they made for services in previous years and combine that information with other factors to determine how much premiums will be in the future. If your health insurance plan estimates that they will need to spend more to cover those in your group or region than they did in the past, it is likely that premiums will go up.
So, how are costs changing for health insurance plans and Coloradans? According to the CO APCD data, across Medicaid, Commercial and Medicare Advantage plans, costs (for insurance plans and patients) have gone up per person per year (PPPY) an average of six percent annually from 2012-2015. The bulk of the increases are related to pharmacy, or drug costs, especially for those with Medicare Advantage plans. Rural Coloradans tend to pay a higher portion of annual out-of-pocket costs than those living in urban areas, and some counties like Phillips and Pitkin spent roughly $2,000 more per person per year than the statewide average.
These initial insights only provide a sliver of what can be learned from the CO APCD Cost of Care reports. Check out more insights in our Cost of Care Infographic, or play around with our interactive report to learn more about variation in costs.
Since it’s our goal to provide the most accurate, comprehensive information possible to Coloradans looking for ways to improve health, health care and costs, we are actively working to incorporate some of the missing data elements – premium information and rebate/discounts – into the database. With these two additional pieces, we will be able to identify even more insights into potential cost savings solutions.
Curious about something? Have an idea about a future Plaintalk Blog? Let us know at info@civhc.org or by commenting below.