CIVHC’s Community Dashboard is a powerful tool that provides Colorado communities with information to understand how various aspects of health care in their region — including costs, utilization, and access — compare to state and other county results. Including claims from a majority of the insured lives represented in the Colorado All Payer Claims Database (CO APCD) from 2013-2020, the Community Dashboard provides a deep well of information to explore.
One of the most powerful and unique way claims data available in the dashboard can be used is to help communities measure quality of care. The Community Dashboard includes quality measures that can help identify whether or not the care being received by Coloradans is occurring according to national standards and guidelines and is contributing to the overall health of the population.
Institute of Medicine[1] defines quality of care as “the degree to which health care services for individuals and populations increase the likelihood of desired health outcomes and are consistent with current professional knowledge.” Using CO APCD data, CIVHC has produced many nationally-endorsed[2] quality measures used by national and state-sponsored programs.
The currently available quality measures can be categorized into three buckets: 1) Prevention, 2) Chronic Condition Management, and 3) Access/Care Coordination.
Quality Measures in the Community Dashboard
 Preventative Care Measures
The Community Dashboard includes two preventive cancer screening measures, which are important for early detection and can ultimately result in a reduction of late stage complications, complex treatments, and mortality. For details, please refer to the methodology document on our Community Dashboard page.
Cervical Cancer Screening
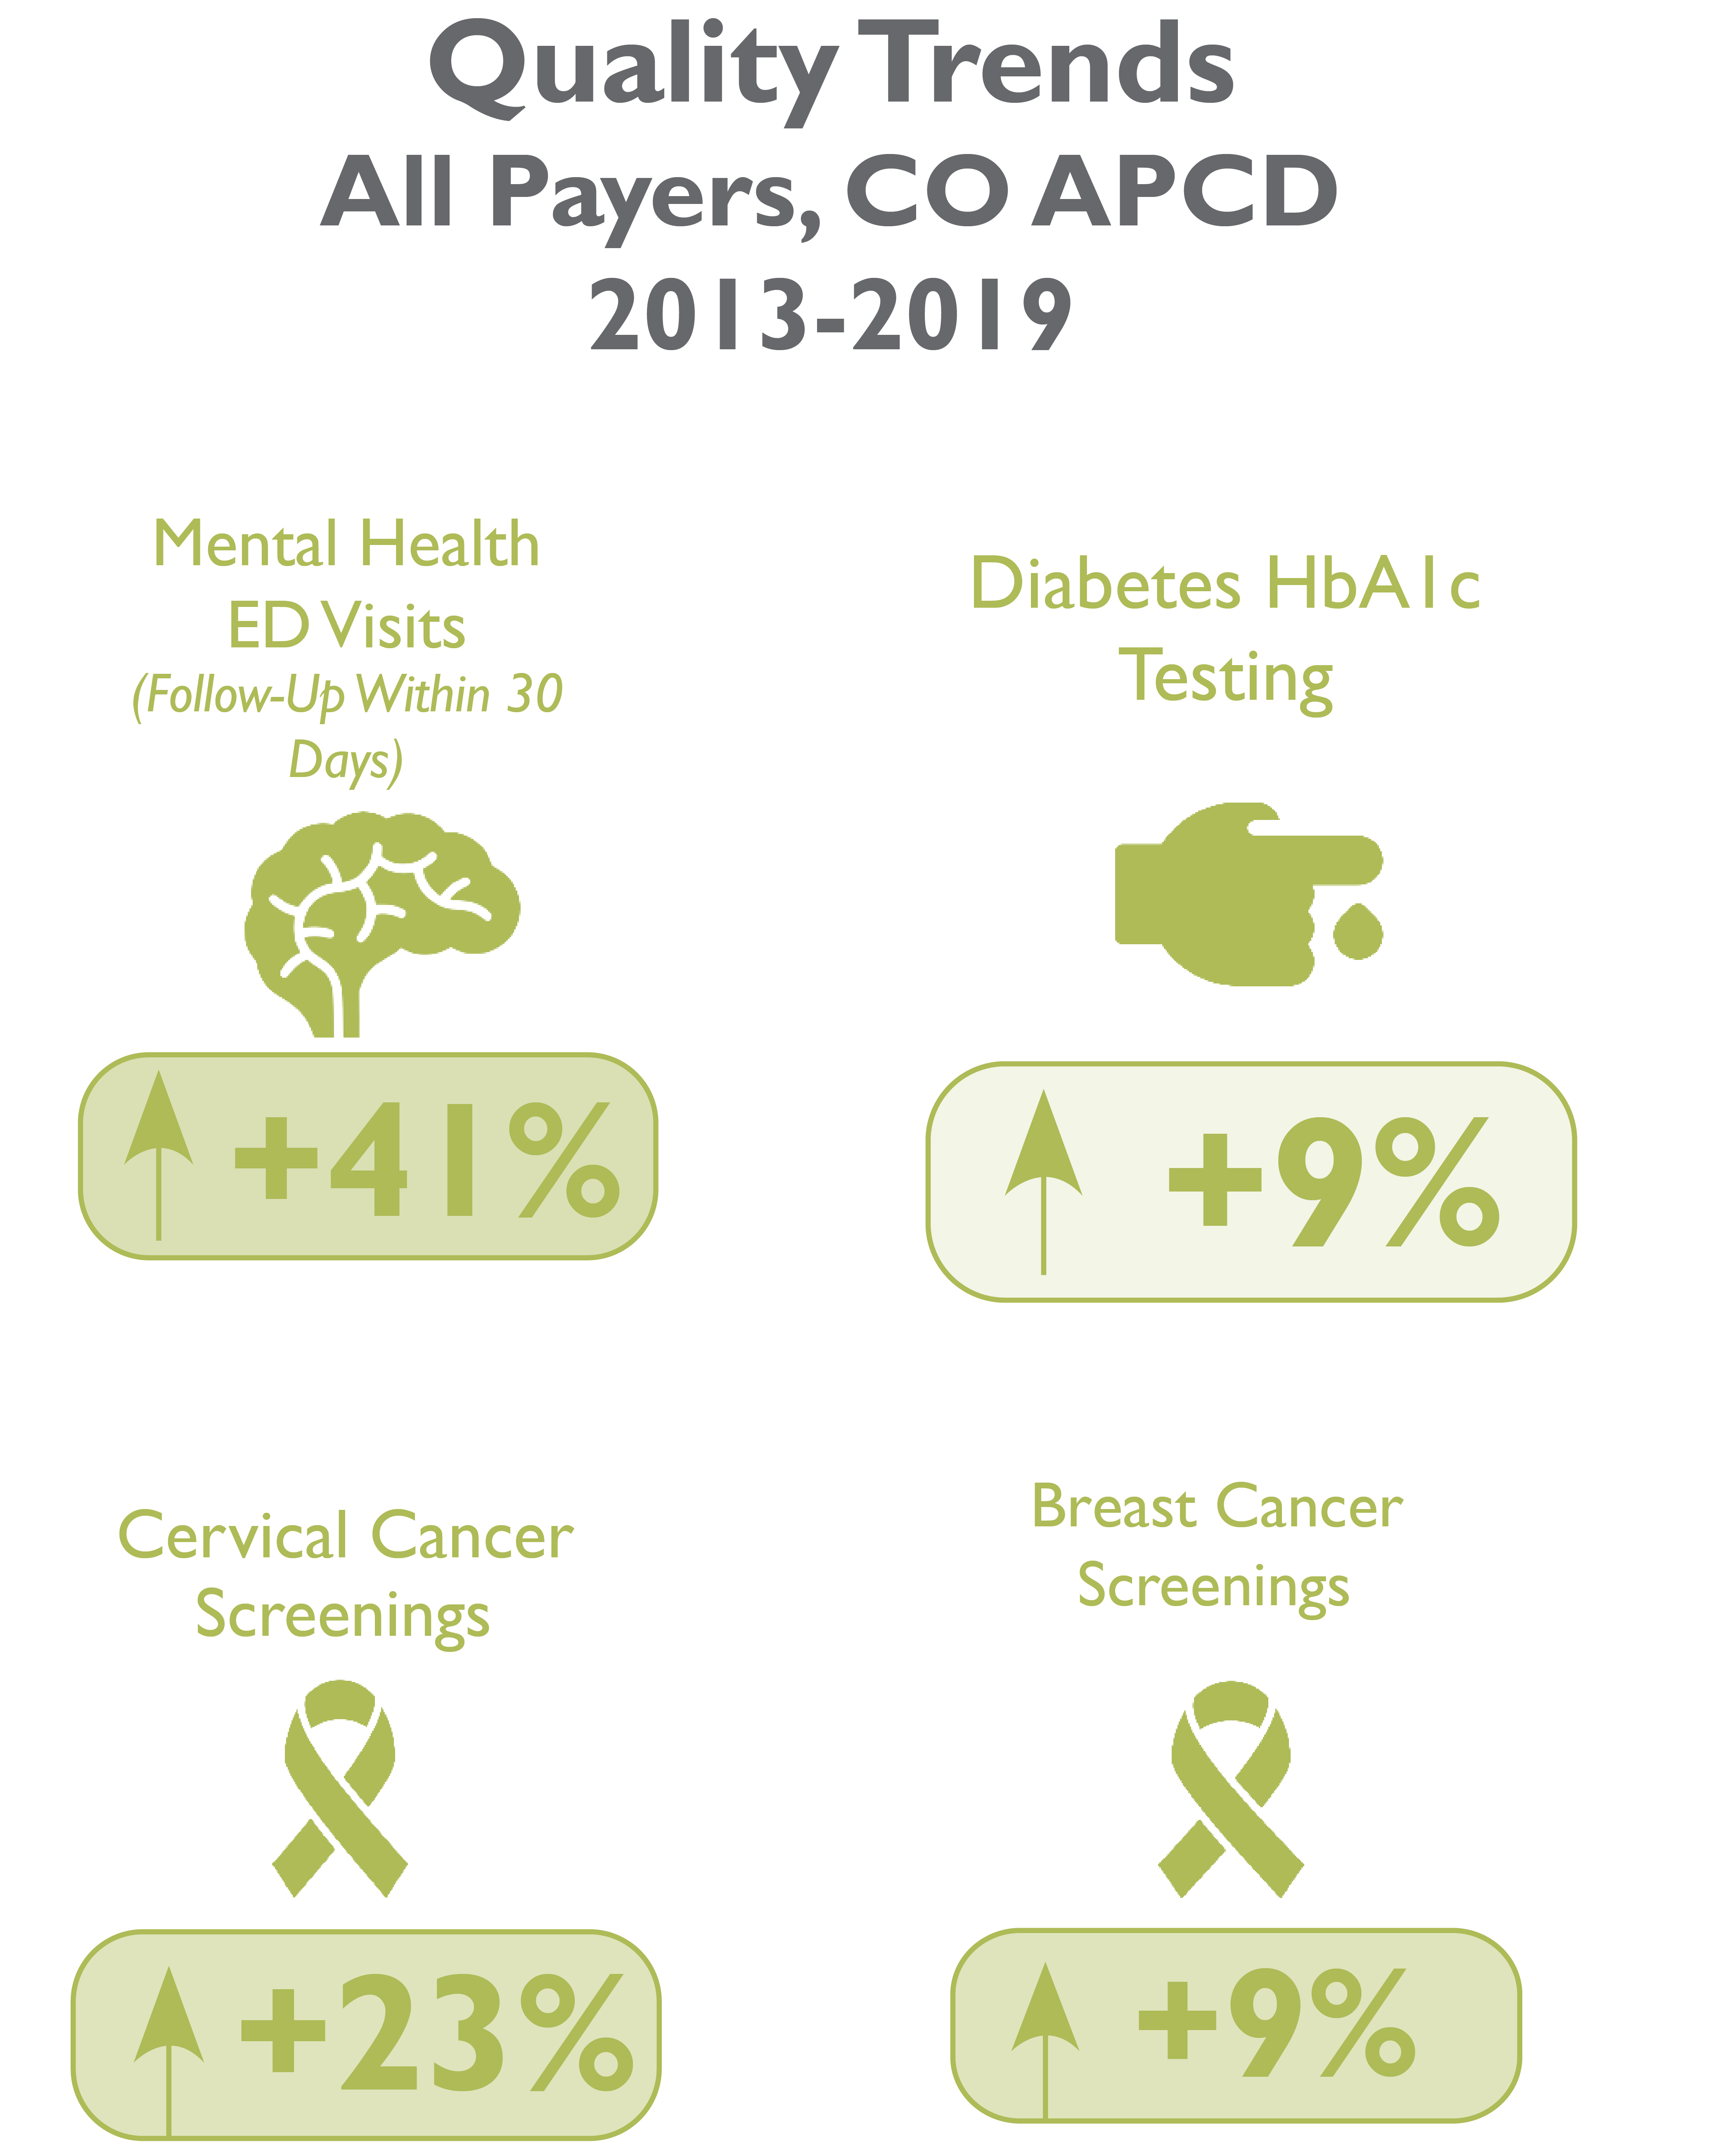
This measures the percentage of women in the recommended age range (21 to 64) who received an appropriate screening for cervical cancer. Appropriate testing is either Cervical Cytology (pap test) or a Human Papillomavirus (HPV) test depending on factors including the patient’s age and when the test was performed. In the years measured in the Community Dashboard, 2013-2019, cervical cancer screenings in Colorado have increased by 23% overall.
Breast Cancer Screening
This measures women 50 to 74 years old who had one or more mammograms to screen for breast cancer during the measurement year and one year prior to the measurement year. Because this measure requires an additional previous year data, breast cancer screening results in the Community Dashboard is only available from 2014 to 2020, which shows a 9% increase in breast cancer screening across all payers.
Chronic Condition Management
The dashboard also includes a measure to identify how well diabetes is being managed according to current guidelines and research, which helps prevent complications for those who have the condition and helps keep them healthy.
Diabetes Hb1Ac Testing
Measures the percentage of people with diabetes (Type I or Type II), who received a Hemoglobin A1c (HbA1c) test in each year. Having HB A1c regularly checked is one needed step to keep HBA1c under control, which means having an HBA1c with a value lower than 8.0% for people with Diabetes. HbA1c testing improved by 9% from 2013-2019.
Follow-Up Visits for Mental Health
New to the Community Dashboard this year are two mental health measures which track whether or not people who visited the emergency room for a mental health-related reason had a follow-up visit with a provider. Follow up visits with a provider within a month, and ideally sooner, have been shown to improve mental health status. Measures across two different follow-up time frames are available in the dashboard:
- Mental Health ED Visits: Follow Up within 30 days
The percentage of people who received a follow-up visit with a provider within a month after visiting the emergency room for mental health-related reasons improved by 41% from 2013-2019.
- Mental Health ED Visits: Follow Up within 7 days
The percentage of people who received follow-up with a provider within a week after visiting the emergency room for mental health-related reasons also improved significantly by 50% from 2013-2019.
National Guidelines on Quality Measures in the Dashboard
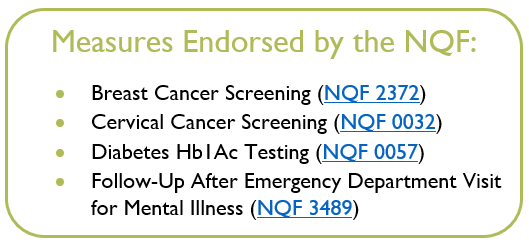 Quality measures included in this report are all endorsed2 by the National Quality Forum (NQF), which sets rigorous data standards used by the Federal Government and across the country by state programs and private entities. Endorsed measures are periodically re-visited for updates and maintenance to keep current to standards and medical knowledge. It is important to note that CIVHC is currently in the process of receiving NCQA certification on these HEDIS® results, which have not been certified as of this blog.
On an annual basis, CIVHC works with its multi-stakeholder board, CO APCD Advisory Committee and other stakeholder partners to determine which quality measures are most valuable to produce in the Community Dashboard. Due to resource constraints, a limited number of new and current measures can be produced annually. In addition to stakeholder feedback, measures are selected based on volume of claims in the CO APCD to be able to adequately represent measure results at the county level, and feasibility of producing the measure with claims data.
Looking at Quality Measures by Community
Although quality of care measures are improving across the state, the value of the Community Dashboard is the ability to look at the variation by county and rural vs. urban breakdowns. When viewing the data regionally, it is clear there are still wide disparities that exist across Colorado communities. Some notable findings in the dashboard when broken down by region include:
- Although improving, only 67% of women statewide receive breast cancer screening and 69% receive cervical cancer screenings
- Testing rates are lower across the board in rural counties compared to urban. Hb1Ac testing drops from 83% in urban counties to 75% in rural counties, and in 14 counties across Colorado 50% or fewer women received cervical cancer screenings in 2020.
- On a positive note, in 2020, 72% of Coloradans who visited the ED for a mental health-related reason received follow-up, although urban counties represent much of this with few rural counties represented in the data due to low volume and suppression guidelines.
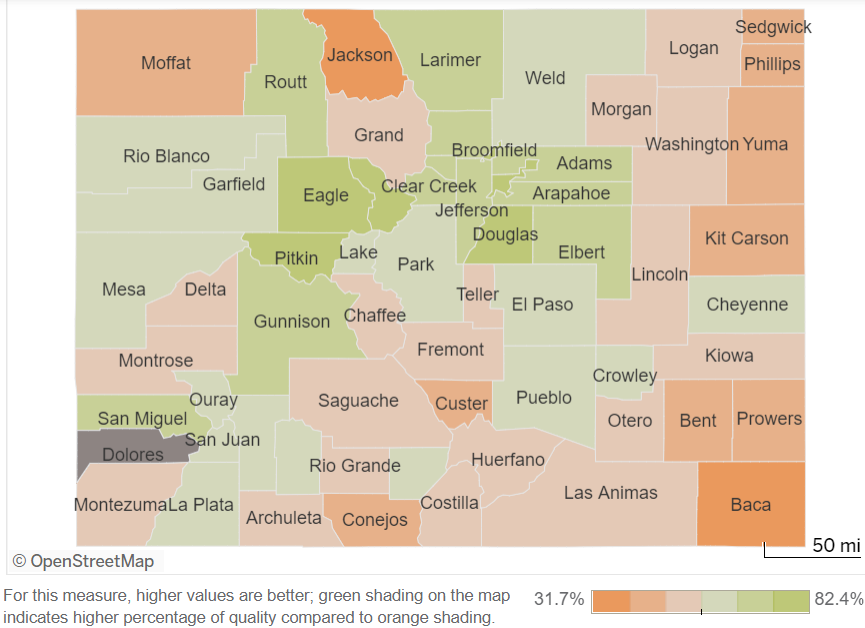
Cervical Cancer test screenings across Colorado counties in 2020
Visit the Community Dashboard to explore further breakouts of quality measures by Division of Insurance region and county and see insights in access to care, utilization, and cost of care across Colorado. Key findings on new measures and an infographic representing overall trends across the measures are also available.
[1] Institute of Medicine. (1990). Medicare: A strategy for quality assurance, Vol.1. Washington, DC, National Academy Press. The dashboard empowers communities and statewide leaders to identify where gaps in quality of care exist, which is the first step to addressing disparities in quality across the state. Let’s explore more about the quality measures available in the Community Dashboard and how they can be used.
[2] The quality measures used in this report are endorsed by the National Quality Forum (NQF): Breast Cancer Screening NQF 2372; Cervical Cancer Screening NQF 0032; Diabetes HbA1c testing NQF 0057; Follow-Up After Emergency Department Visit for Mental Illness NQF 3489. Note: the logic used to produce these HEDIS® results has not been certified by NCQA as of this blog. The results are based on unadjusted HEDIS specifications and have not been audited by an NCQA-Certified Auditor. Such results are for reference only and are not an indication of measure validity.