As the CO APCD nears almost one billion total claims, the latest version of the interactive Insights Dashboard shows a steady rise in behavioral health services since 2013. The Insights Dashboard helps users understand the contents of the CO APCD and how it has changed over time by population, payer, claim type and claim volume. Additional information on what percentage of the insured population is represented in each county and other important coverage information is also included.
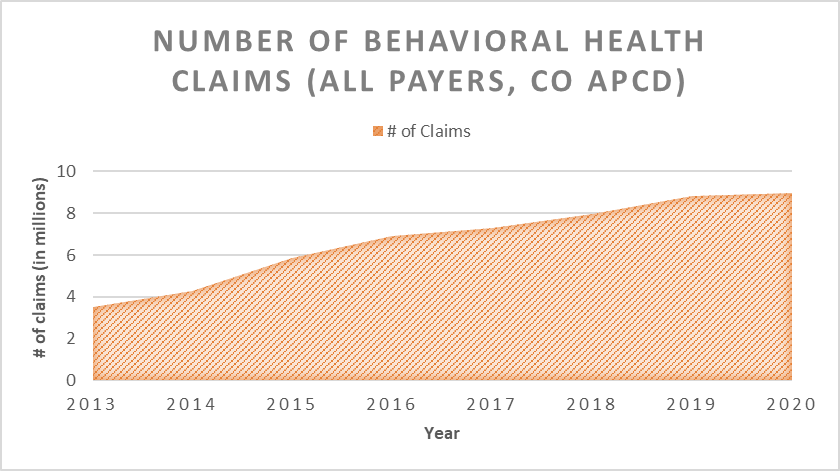
The new dashboard shows that claims for behavioral health services have climbed steadily since 2013 across all payer types. Behavioral health services per person in the database nearly doubled from 2013 to 2020, going from 1.2 claims per person to 2.3. For the last five years, claims with a behavioral health service have increased by 6% or more per year, and in 2020, there were nearly nine million claims, an increase of 155% from 2013. During the first year of the COVID-19 pandemic, there were approximately 1.2 million claims for Coloradans receiving one or more behavioral health services
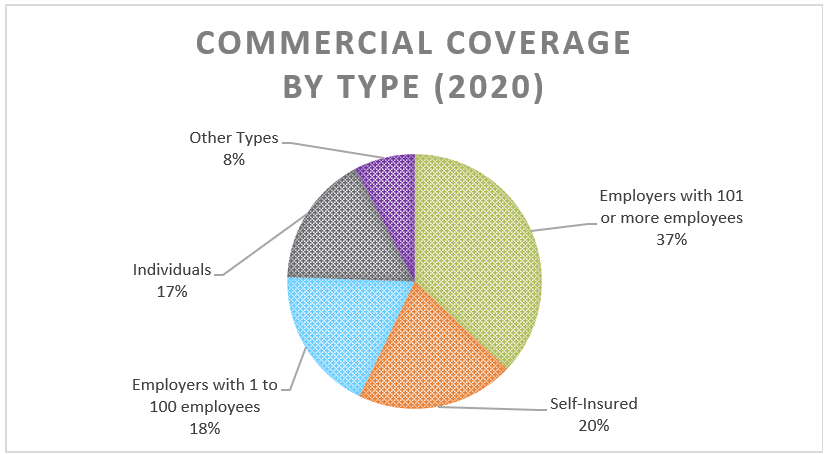
New to the dashboard with this update is the inclusion of individual, self-insured and employer size breakouts for those with commercial coverage by county. Below is a statewide breakdown of commercial coverage by type in 2020:
Since inception nearly 10 years ago, the CO APCD has grown in depth and breadth and now contains:
- 780 million+ claims
- 8 million+ covered lives
- 44 distinct payers
This robust and comprehensive resource is critical for Change Agents across the state and nation to identify opportunities to improve the health of Coloradans and address rising health care costs. Please visit our website to learn more about public and non-public data and analyses that can be gleaned from the CO APCD, or contact us at info@civhc.org for more information.