The Ask the Analyst series is a deep dive into the data by those most familiar with the CO APCD – the analysts themselves. We’ll hear about their experiences with recent analyses and answer any pressing questions that come up. Have a question for the CIVHC Analyst Team? Email it to info@civhc.org.

Analyst Name: Maria de Jesus Diaz-Perez
Featured Project: Updated Shop for Care Tool
This tool provides price and quality information for a number of health care services that consumers can use to find high value providers and facilities.
What were your first steps when beginning this analysis?
Our first step was to research what health care services we could include, how we should calculate the prices, and what were the best ways to present the information to the public. When I joined CIVHC a few years ago, I researched what other state APCDs were doing regarding price transparency and what academic research had found about what and how to present useful, consumer-friendly price transparency information.
Based on this review, focus group information CIVHC conducted, and analysis of volume of claims, we selected health care services to display and determined how to calculate prices and display the information. For example, prices for the procedures represent total costs, which includes what the plan and the patient typically pay before, during and after the actual procedure (for a delivery, colonoscopy, knee replacement, etc.). During our consumer focus groups, we learned that people wanted to understand the full price of a service, which is why we chose to display prices for what is known as episodes of care.
Our final list of services includes things that are elective (for example, bariatric surgery), or things that are planned in advance (i.e., a mammography), since consumers often don’t have the luxury of shopping around for emergency services.
Were there specific factors you needed to consider based on the data?
We needed to consider a number of things like what payer types to include in the analysis, what type of providers/facilities to include, and, as mentioned above, what health care services to provide. We also made decisions on how to calculate the prices for this analysis.
As discussed, we selected episode-prices for procedures, but we also had to make decisions about how to estimate the prices of imaging services. First, we decided to include only outpatient providers, which means that prices for imaging services that take place when you are hospitalized are not included in the results. We also had to decide what exactly we were going to include in the prices for the imaging services. For example, even when a specific imaging service is represented by limited procedure codes, exactly how the service is billed varies among different provider types (e.g., diagnostic imaging center, hospital outpatient, clinic).
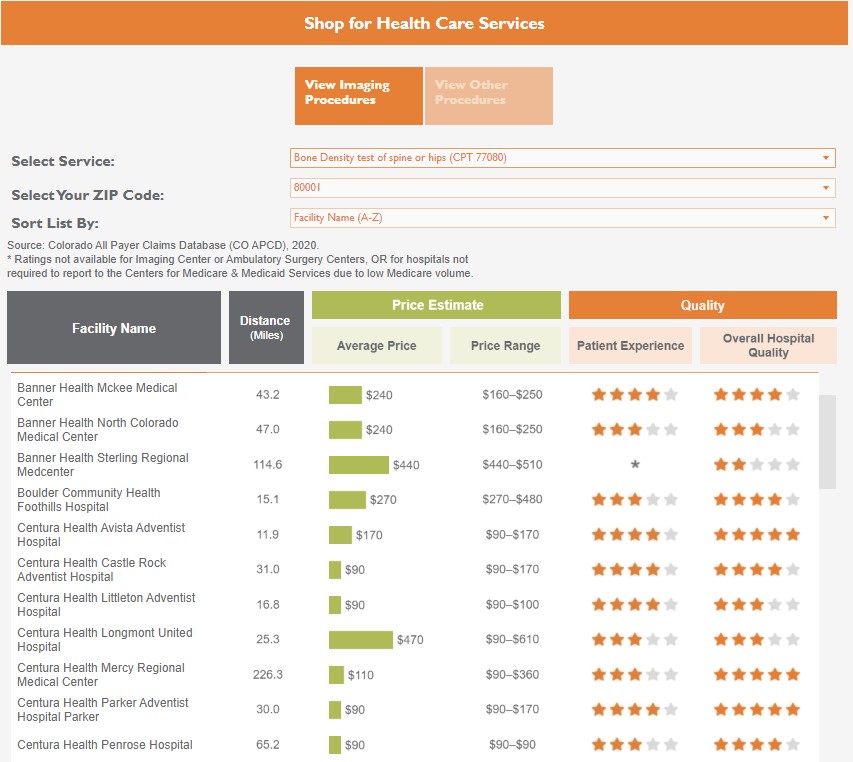
We needed to find a method to represent the price for all provider types. We ultimately decided to show the price only for the test itself, rather than additional provider charges which are difficult to estimate and vary widely. We are aware that this decision only provides information for a portion of the cost in most cases, but provides consumers with a starting point to understand the ranges of prices. We will continue to evaluate how we calculated services to look for better ways to captures as many services as possible in a comparable away.
What challenges did you encounter while performing the analysis? How did you overcome them?
We had three main challenges. The first, as mentioned before, was how to represent prices that are comparable across provider types, given the variation on billing practices.
The second challenge was to represent the data from the CO APCD in a friendly/usable way to consumers. In order to do this, we had to identify providers ‘as consumers know them’. Many providers have an official name that comes across in the CO APCD that does not look at all similar to their business name (the name you see on their website). The provider or facility address in the data warehouse is often their administrative or main office, not the address where they provide services. For this reason, over the years we’ve built a master list with business names, (those names consumers know), as well as the addresses where consumers receive services. This list is always evolving because providers close, or are acquired by health systems and change their names. We revise this list every year as we update the data.
The third challenge was finding ways to demonstrate quality of care for the providers displayed. Pairing price information with quality is recommended by best practices and academic research. We decided to use quality measures created by the Centers for Medicare and Medicaid Services (CMS). We use the Hospital Overall Rating, which provides consumers with a simple overall five-star rating generated by combining multiple dimensions of quality into a single summary score. We also used the CMS patient experience five-star ratings. The advantage of using these two CMS ratings is that we could share validated measures that are easy to understand by consumers. The disadvantage is that these measures speak of the quality of care and patient experience of the providers in general and not necessarily about the quality related to individual procedures. The other disadvantage is that these quality measures are not available for non-hospital providers. As with other components of this analysis, we will continue exploring ways to improve the quality measures included.
Without delving into results, did anything surprise you about this analysis or the process of executing it?
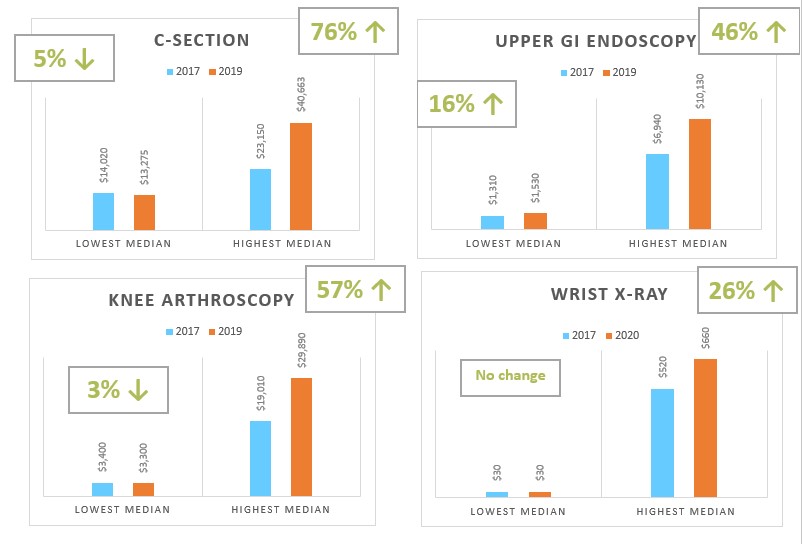
I would not say it is completely surprising, but it is disconcerting to see the excessive variation in health care prices. We are talking about services that are needed, not ‘wanted’. Who wants an X-Ray, Ultrasound, or Cataract surgery? We need these services either to properly diagnose a health problem, or to improve our health and well-being. Not everyone can access health care due to exorbitant prices, and we need to build a health system where everyone who needs services will be able to receive them without fear of significant financial impact.
What did you learn while performing this analysis?
Health care billing has enough variation that even a seemingly simple analysis, like calculating a price range, requires to make decisions that leave out some information. The information provided in this analysis is a guide that can help consumers choose lower prices and advocate for more affordable services for themselves and their families.